In an era defined by increasing environmental consciousness and volatile energy markets, the ability to effectively manage and optimize energy consumption has become paramount for businesses and organizations worldwide. The year 2026 marks a crucial point, with regulatory landscapes evolving and the imperative for sustainable operations growing stronger. Understanding your 2026 Energy Report is not just about compliance; it’s about unlocking significant operational efficiencies, reducing costs, and contributing to a greener future. This comprehensive guide will delve into the critical metrics you need to track within your 2026 Energy Report to achieve an ambitious yet attainable 12% improvement in efficiency.
The journey towards enhanced energy efficiency begins with insightful data analysis. Your 2026 Energy Report is a goldmine of information, detailing consumption patterns, peak demands, cost breakdowns, and carbon emissions. However, merely possessing this data is insufficient. The true power lies in interpreting these figures, identifying trends, pinpointing inefficiencies, and translating these insights into actionable strategies. Our goal is to equip you with the knowledge to not only understand your report but to leverage it as a strategic tool for continuous improvement.
Achieving a 12% improvement in efficiency might seem daunting, but by focusing on the right metrics and adopting a systematic approach, it is entirely within reach. This article will break down the essential components of a robust energy management strategy, from initial data collection and baseline establishment to advanced analytical techniques and the implementation of targeted interventions. We will explore how to set realistic goals, monitor progress, and foster a culture of energy awareness within your organization. Prepare to transform your approach to energy, moving from reactive consumption to proactive, intelligent management.
The Foundation: What is Your 2026 Energy Report?
Before diving into specific metrics, it’s essential to have a clear understanding of what constitutes your 2026 Energy Report. This document, or suite of documents, provides a snapshot of your organization’s energy performance over a defined period, typically a year. It aggregates data from various sources, including utility bills, sub-meters, and potentially building management systems (BMS). The report is designed to offer transparency into your energy consumption, expenditure, and environmental impact.
Key Components of a Comprehensive Energy Report:
- Consumption Data: Detailed breakdown of electricity, gas, water, and other fuel sources consumed, often presented in kWh, therms, or other relevant units.
- Cost Data: Total expenditure on each energy source, including tariffs, taxes, and demand charges.
- Demand Profiles: Hourly, daily, or monthly peak demand figures, which are crucial for understanding consumption patterns and potential for demand-side management.
- Carbon Emissions: Calculation of greenhouse gas (GHG) emissions associated with energy consumption, often expressed in tonnes of CO2 equivalent (tCO2e).
- Energy Intensity: Energy consumption normalized by a relevant operational metric, such as square footage, production units, or occupancy rates.
- Renewable Energy Generation: If applicable, data on self-generated renewable energy and its contribution to overall consumption.
- Historical Comparison: Benchmarking against previous periods to identify trends and assess performance changes.
The accuracy and completeness of your 2026 Energy Report are paramount. Inaccurate data can lead to misguided decisions and missed opportunities for improvement. Therefore, ensuring robust data collection processes and regular validation is the first step towards achieving any efficiency goals. Consider investing in smart metering infrastructure if you haven’t already, as it provides granular data that is invaluable for detailed analysis.
Establishing Your Baseline: The Starting Point for 12% Improvement
You can’t track progress without a starting point. Establishing a clear energy baseline from your 2026 Energy Report is fundamental to measuring the effectiveness of any efficiency initiatives. A baseline represents your typical energy consumption and cost before implementing any changes. It serves as the benchmark against which all future performance will be compared.
How to Establish an Effective Baseline:
- Select a Representative Period: Choose a period (e.g., the previous 12 months) that is free from unusual operational disruptions or significant changes in activity.
- Normalize Data: Account for variables that can influence energy consumption but are outside of your control, such as weather patterns (using heating and cooling degree days), production levels, or occupancy rates. This normalization ensures a fair comparison.
- Calculate Key Baseline Metrics: Determine your average energy intensity, total energy spend, and carbon footprint for the baseline period.
Once your baseline is established, your 12% efficiency target becomes quantifiable. For example, if your baseline energy consumption was 1,000,000 kWh per year, a 12% improvement would mean reducing that to 880,000 kWh per year. This clear objective provides a tangible goal for your energy management efforts.
Critical Metrics to Track in Your 2026 Energy Report for a 12% Improvement
To achieve a substantial 12% improvement in energy efficiency, you need to go beyond surface-level reporting. This requires a deep dive into specific, actionable metrics within your 2026 Energy Report.
1. Energy Intensity (EI): The Ultimate Efficiency Indicator
Energy Intensity is arguably the most crucial metric. It quantifies the amount of energy consumed per unit of output or activity. This allows for an ‘apples-to-apples’ comparison over time, even if your operational output changes. Examples include kWh per square foot (buildings), kWh per unit produced (manufacturing), or kWh per occupant (offices).
- Why it’s critical: A decrease in EI directly indicates improved efficiency, regardless of changes in overall activity levels. It helps isolate the impact of efficiency measures from growth or contraction.
- How to track: Divide total energy consumption by your chosen operational metric. Monitor this trend monthly and annually.
- Actionable insights: A stagnant or increasing EI suggests inefficiencies. Investigate specific areas where energy consumption per unit of output is high.
2. Peak Demand (kW): Avoiding Costly Spikes
Peak demand refers to the highest rate at which your facility consumes electricity during a billing cycle. Utilities often charge significant demand charges based on these peaks, even if they are momentary.
- Why it’s critical: Reducing peak demand directly translates to lower electricity bills, even if total consumption remains stable. It’s a prime target for quick cost savings.
- How to track: Your 2026 Energy Report should detail peak demand figures. Analyze the timing and magnitude of these peaks.
- Actionable insights: Implement demand-side management strategies such as load shedding, shifting non-essential processes to off-peak hours, or using on-site generation during peak times.
3. Load Factor: Optimizing Usage Patterns
The load factor is the ratio of average power demand to peak power demand over a period. A higher load factor indicates more consistent energy use and less variability, which is generally more efficient and cost-effective.
- Why it’s critical: A low load factor suggests inefficient use of infrastructure and potentially higher demand charges. Improving it means better utilization of your energy capacity.
- How to track: Calculate as (Average Power / Peak Power) x 100%. Analyze trends in your 2026 Energy Report.
- Actionable insights: Identify equipment or processes causing significant fluctuations. Stagger equipment start-ups, optimize scheduling, and consider energy storage solutions to flatten your load profile.
4. Specific Energy Consumption (SEC): Granular Efficiency
SEC goes a step further than overall Energy Intensity, focusing on the energy consumed by specific pieces of equipment, processes, or departments. This requires sub-metering or detailed process data.
- Why it’s critical: Pinpoints exact areas of inefficiency, allowing for targeted interventions. It’s essential for equipment-level optimization.
- How to track: Install sub-meters on major energy-consuming assets or departments. Integrate this data into your 2026 Energy Report analysis.
- Actionable insights: Benchmark SEC against industry standards or manufacturer specifications. Identify underperforming equipment for maintenance, upgrades, or replacement.
5. Cost per Unit of Energy and Total Energy Spend: Financial Impact
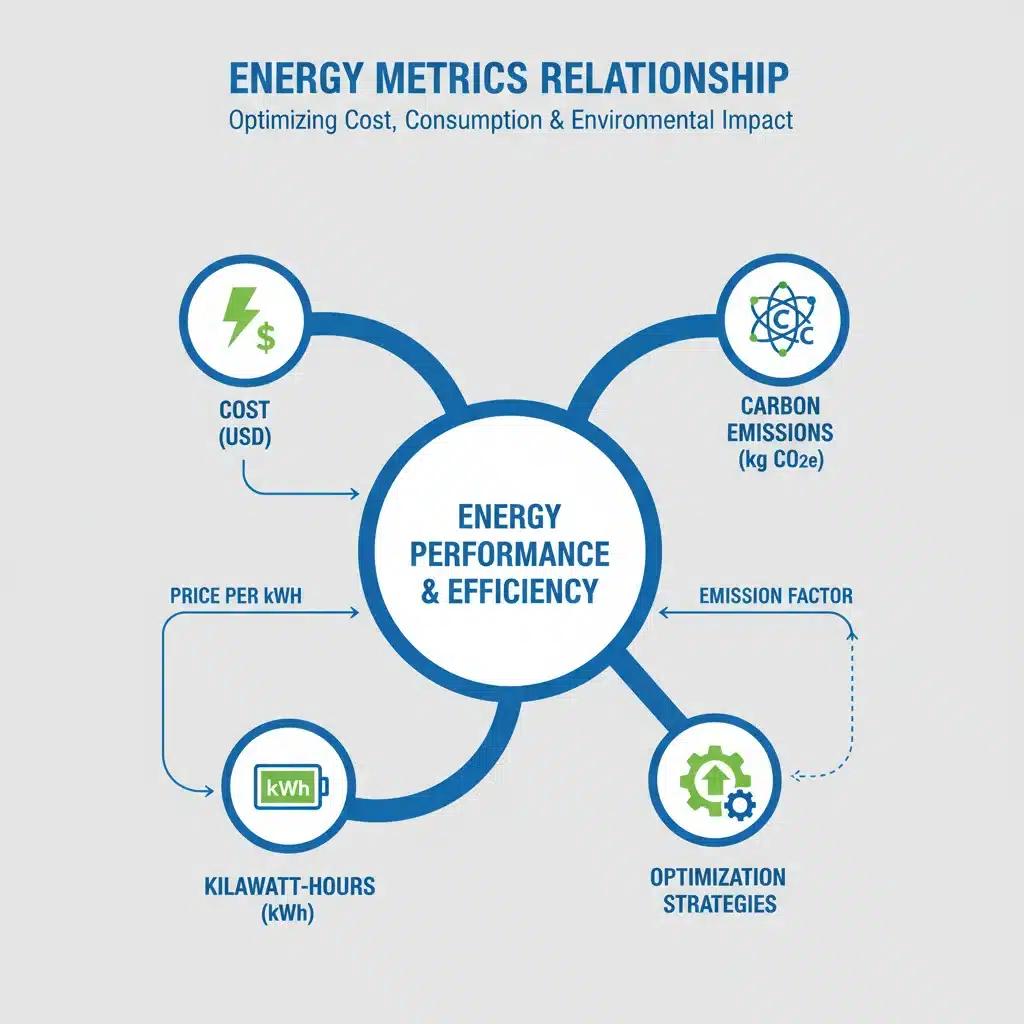
While efficiency is about reducing consumption, cost is the financial bottom line. Tracking both the cost per unit (e.g., $/kWh) and total energy spend provides a complete financial picture.
- Why it’s critical: Directly quantifies the financial benefits of efficiency improvements. Helps justify investments in energy-saving technologies.
- How to track: Analyze utility bills and consolidate total energy expenditures from your 2026 Energy Report.
- Actionable insights: Negotiate better rates with suppliers, explore time-of-use tariffs, and prioritize efficiency projects with the highest ROI.
6. Carbon Emissions (tCO2e): Environmental Performance
The carbon footprint associated with your energy consumption is a key sustainability metric, increasingly important for corporate social responsibility and regulatory compliance.
- Why it’s critical: Measures your environmental impact and progress towards decarbonization goals.
- How to track: Convert energy consumption data into tCO2e using relevant emission factors (often provided in your 2026 Energy Report or by government agencies).
- Actionable insights: Prioritize reductions in high-emission energy sources, invest in renewable energy, and explore carbon offsetting strategies.
Leveraging Your 2026 Energy Report for Actionable Insights
Once you’ve identified the key metrics, the next step is to use your 2026 Energy Report to generate actionable insights. This involves more than just reading the numbers; it requires analytical thinking and strategic planning.
Data Visualization and Trend Analysis:
Visualizing your energy data through charts, graphs, and dashboards can reveal patterns that raw numbers might obscure. Look for:
- Seasonal Trends: How does consumption change with seasons? Are heating and cooling systems optimized?
- Daily/Weekly Profiles: Are there significant energy draws during non-operational hours? This points to phantom load or equipment left running unnecessarily.
- Correlations: Does energy consumption correlate with production levels, occupancy, or weather? Understanding these relationships helps normalize data and identify anomalies.
Benchmarking and Goal Setting:
Compare your performance against:
- Historical Data: Your own past performance is the primary benchmark for tracking that 12% improvement.
- Industry Best Practices: How do you stack up against similar organizations in your sector? This can highlight areas for significant improvement.
- Internal Targets: Set specific, measurable, achievable, relevant, and time-bound (SMART) goals for each key metric.
Root Cause Analysis:
When an anomaly or inefficiency is identified in your 2026 Energy Report, conduct a root cause analysis. For example, if peak demand is consistently high on Tuesday mornings, investigate what operations commence at that time. Is it a specific machine, a batch process, or an HVAC system kicking in?
Strategies for Achieving a 12% Energy Efficiency Improvement
With a deep understanding of your 2026 Energy Report and key metrics, you can now implement targeted strategies to drive that 12% improvement.
1. Implement Energy Management Systems (EMS):
An EMS can automate data collection, provide real-time monitoring, and offer advanced analytics. It centralizes energy data, making it easier to track progress against your 2026 Energy Report goals and identify optimization opportunities.
2. Optimize HVAC Systems:
Heating, Ventilation, and Air Conditioning often account for a significant portion of energy consumption. Strategies include:
- Regular Maintenance: Ensure filters are clean, coils are efficient, and controls are calibrated.
- Smart Thermostats/Controls: Program setbacks during unoccupied hours and optimize temperature setpoints.
- Building Envelope Improvements: Seal leaks, improve insulation, and upgrade windows to reduce heating and cooling loads.
- Variable Frequency Drives (VFDs): Install VFDs on motors in HVAC systems to match fan and pump speeds to actual demand.
3. Upgrade Lighting to LED:
This is often one of the quickest and most cost-effective ways to reduce electricity consumption. LEDs use significantly less energy and have a longer lifespan than traditional lighting.
- Install Sensors: Occupancy sensors and daylight harvesting controls can further reduce lighting energy use.
4. Optimize Industrial Processes and Equipment:
For manufacturing or process-heavy industries, focus on:
- Motor Efficiency: Upgrade to high-efficiency motors (e.g., NEMA Premium efficiency motors) and ensure they are appropriately sized for the load.
- Compressed Air Systems: Identify and fix leaks, optimize compressor controls, and ensure proper maintenance. Compressed air is notoriously energy-intensive.
- Process Optimization: Review and refine production schedules, reduce waste heat, and implement heat recovery systems.
5. Engage Employees:
Human behavior plays a significant role in energy consumption. Foster a culture of energy awareness through:
- Training and Education: Inform employees about energy-saving practices (e.g., turning off lights, shutting down equipment).
- Awareness Campaigns: Use signage, internal communications, and competitions to promote energy conservation.
- Feedback: Share progress from your 2026 Energy Report with employees to demonstrate the impact of their actions.

6. Explore Renewable Energy and Energy Storage:
While focused on efficiency, integrating renewable energy sources can further reduce reliance on the grid and contribute to your overall sustainability goals. Energy storage solutions can help manage peak demand and optimize renewable energy use.
Monitoring Progress and Continuous Improvement
Achieving a 12% efficiency improvement is not a one-time event but an ongoing process. Regular monitoring and continuous adjustment are critical.
Regular Reporting and Review:
Establish a schedule for reviewing your 2026 Energy Report data, perhaps monthly or quarterly. Compare current performance against your baseline and the 12% target. Identify deviations and investigate their causes.
Measurement and Verification (M&V):
For significant energy efficiency projects, implement M&V protocols. This involves rigorously measuring the actual energy savings achieved by a project and comparing them to projected savings. M&V provides quantifiable evidence of success and helps refine future projections.
Adaptive Management:
Energy systems are dynamic. As operations change, technology evolves, and external factors shift, your energy management strategy must adapt. Use insights from your 2026 Energy Report to continuously refine your approach, identify new opportunities, and adjust targets as needed.
The Broader Impact of Optimizing Your 2026 Energy Report
The benefits of a 12% improvement in energy efficiency extend far beyond immediate cost savings. By diligently tracking the key metrics in your 2026 Energy Report, your organization can realize a multitude of positive impacts:
Enhanced Financial Performance:
- Reduced Operational Costs: Lower energy consumption directly translates to reduced utility bills, freeing up capital for other investments.
- Increased Competitiveness: Lower operating costs can give you a competitive edge in the market.
- Improved Asset Value: Energy-efficient buildings and equipment often command higher market values.
Improved Environmental Stewardship:
- Lower Carbon Footprint: Reduced energy consumption, particularly from fossil fuels, directly lowers your greenhouse gas emissions, contributing to climate change mitigation.
- Resource Conservation: More efficient energy use means less demand on natural resources used for energy generation.
- Positive Public Image: Demonstrating commitment to sustainability can enhance your brand reputation and appeal to environmentally conscious customers and investors.
Operational Benefits:
- Increased Energy Security: Reduced reliance on external energy sources can mitigate risks associated with supply disruptions and price volatility.
- Enhanced Equipment Lifespan: Optimized energy use often means equipment is running more efficiently, leading to less wear and tear and longer operational life.
- Better Indoor Environmental Quality: Efficient HVAC systems can lead to more consistent temperatures and improved air quality, benefiting employee comfort and productivity.
- Regulatory Compliance: Staying ahead of evolving energy efficiency regulations can prevent penalties and demonstrate leadership.
Innovation and Future-Proofing:
- Adoption of Advanced Technologies: A focus on efficiency often encourages the exploration and adoption of smart energy technologies, positioning your organization for future advancements.
- Resilience: A well-managed energy profile contributes to overall organizational resilience in the face of various challenges.
Conclusion: Your 2026 Energy Report as a Catalyst for Change
The 2026 Energy Report is far more than a mere record of consumption; it is a powerful diagnostic tool and a strategic roadmap. By meticulously tracking energy intensity, peak demand, load factor, specific energy consumption, cost metrics, and carbon emissions, organizations can gain unparalleled insights into their energy performance.
The goal of achieving a 12% improvement in efficiency is ambitious but entirely achievable through a combination of diligent data analysis, targeted interventions, and a commitment to continuous improvement. This journey requires a holistic approach, encompassing technological upgrades, operational optimizations, and active employee engagement.
Embrace your 2026 Energy Report as the catalyst for transformation. By understanding its nuances and acting on its insights, your organization can not only realize significant financial savings and reduce its environmental footprint but also enhance its operational resilience and solidify its position as a leader in sustainable practices. The future of energy management is proactive, data-driven, and focused on efficiency – and your 2026 report is the key to unlocking that future.